Why Hyped Stocks Always Crash After Retail Investors Buy — The Pump, FOMO, and Dump Cycle Explained
⚠️ Disclaimer: The information provided in this article is for general educational and informational purposes only. It does not constitute financial advice, investment recommendations, tax advice, or any solicitation to buy, sell, or hold any financial instrument, security, or product. All examples, numbers, interest rates, stock prices, and return figures mentioned are illustrative or historical in nature and do not guarantee future results. Investments in stocks, mutual funds, IPOs, commodities (gold, silver), and other financial instruments are subject to market risk. Past performance is not indicative of future returns. Tax laws and financial regulations mentioned are based on information available at the time of writing and may have changed. Readers are strongly advised to consult a SEBI-registered investment advisor, certified financial planner, or qualified tax professional before making any financial or investment decisions. RozHisab is a personal finance tracking and budgeting tool — it is not a SEBI-registered investment advisory service and does not provide investment advice.
A stock appears on your top gainers today list. Three days in a row.
Then it hits upper circuit — the maximum allowed price increase in a single day. Then upper circuit again. A finance influencer on YouTube posts a video. A WhatsApp group erupts with screenshots. Your colleague tells you he's already up 35%.
You buy.
Within two weeks, the stock is down 55% from your entry price. The YouTube video is deleted. The WhatsApp group goes silent. Your colleague stops talking about stocks.
This is not bad luck. This is not a coincidence. This is a pattern with a name, a mechanism, and specific people who profit from it — at your expense.
This article explains exactly how it works — from the first volume spike to the final crash — and what you can do to never fall for it again.
The Retail Investor Trap — How It Starts
Every retail investor trap begins the same way. Understanding the starting conditions is how you spot it before you're inside it.
Step 1 — The Quiet Accumulation Phase
Before a stock goes viral, someone is buying it quietly.
In India's stock market, these are called stock market operators — a term used to describe individuals or groups who accumulate large positions in small or mid-cap stocks with the deliberate intention of driving the price up and selling to late-arriving retail investors.
Who are operators in the stock market?
Stock market operators are not a myth or a conspiracy theory.
They are a documented phenomenon that SEBI has investigated,
penalised, and published enforcement orders about for decades.
They are typically:
- High-net-worth individuals or syndicates with access to large capital
- Promoters of small companies colluding with operators to inflate their stock price
- Brokers or sub-brokers who coordinate buying across multiple accounts
- Social media influencers paid to promote stocks after operators have already accumulated positions
During the accumulation phase, they buy quietly — in small amounts, spread across multiple accounts, over days or weeks. Volume is slightly elevated but not dramatically so. The price barely moves. Nobody is watching yet.
Step 2 — The Volume Spike and Price Spike
Once operators have built a large enough position, they begin actively pushing the price higher through coordinated buying. This is when the volume spike becomes visible.
A stock that was trading 1 lakh shares/day suddenly trades 15–20 lakh shares. The price moves 8–12% in a single session. Retail investors scanning for stocks with increasing volume or volume increase stocks start noticing it.
This is the moment the trap is set.
What causes the price spike:
- Coordinated buying across operator-controlled accounts creates artificial demand
- The stock hits upper circuit — the NSE/BSE-mandated maximum daily price increase (5%, 10%, or 20% depending on the circuit filter applied to that stock)
- Upper circuit days create a queue of buyers who couldn't buy — which generates media coverage and word of mouth
- The stock appears on "stocks hit upper circuit today" screeners — putting it in front of tens of thousands of retail investors simultaneously
What Is Upper Circuit — And Why It's a Trap Signal, Not a Buy Signal
What Is Upper Circuit in Share Market?
An upper circuit is a price ceiling that the exchange (NSE or BSE) places on how much a stock can rise in a single trading session. When a stock hits this ceiling, trading is paused or heavily restricted for the rest of the day.
Upper circuit and lower circuit limits in India:
- 2% circuit: Applied to highly volatile or illiquid stocks under exchange surveillance
- 5% circuit: Stocks under ASM (Additional Surveillance Measure) framework
- 10% circuit: Mid-cap and small-cap stocks with moderate liquidity
- 20% circuit: Most other listed stocks
- No circuit: Large Nifty 50 stocks have no individual circuit limits (index-level circuits apply)
What is lower circuit: The opposite — a floor below which a stock cannot fall in a single session. When a stock hits lower circuit, there are only sellers and no buyers — which is when panic and inability to exit become the retail investor's nightmare.
Here is the critical insight most retail investors miss:
A stock hitting upper circuit 5 days in a row does NOT mean it is a good stock. It may mean the opposite — that operators are artificially driving the price up, creating a queue of eager retail buyers, and preparing to sell their large accumulated position into that demand.
In fact, consecutive upper circuits in a small or mid-cap stock with no fundamental news is one of the strongest warning signs of operator activity.
The FOMO Phase — Where Retail Investors Enter
What Is FOMO Investing?
FOMO — Fear Of Missing Out — is the psychological driver that causes retail investors to buy stocks that have already risen dramatically, purely because they fear missing further gains.
FOMO investing is arguably the single most expensive emotional bias in retail investing. And it is deliberately engineered in pump-and-dump schemes — not accidentally triggered.
How FOMO is manufactured in the retail trap:
📱 Social media amplification: Paid influencers — some with millions of subscribers — post videos about the "hidden gem" stock after operators have already accumulated. They are either paid directly or given early positions. Their audience rushes to buy.
💬 WhatsApp and Telegram tips: "Hot tip" messages about the stock flood investor groups. Each message shows the gains already made — which intensifies FOMO rather than prompting caution.
📈 Screener visibility: The stock appears on every retail investor's screener for "gainers today," "upper circuit stocks list," "stocks with upper circuit," and "stocks with increasing volume." Passive discovery drives new buyers who did no research beyond "it went up a lot."
📺 News coverage: Financial news channels cover stocks hitting multiple upper circuits. Anchors ask analysts why the stock is rising. Analysts — who also don't know — speculate positively. Retail viewers buy.
The result: hundreds of thousands of retail investors simultaneously buying a stock near its peak — driven entirely by the fear of missing out on gains they've watched others achieve.
This is the moment operators have been waiting for since the accumulation phase began.
What Is a Stock Market Bubble — And Why Every Pump Creates a Micro-Bubble
What Is a Stock Market Bubble?
A stock market bubble occurs when the price of a stock (or the overall market) rises far above its fundamental value — driven by speculative demand, narrative, and momentum rather than actual earnings, revenue, or assets.
Historically famous stock market bubbles:
- Tulip Mania (1637): Dutch tulip bulbs reached prices equivalent to Amsterdam canal houses before collapsing entirely
- Dot-com Bubble (2000): Internet companies with zero revenue were valued at billions. Nasdaq fell 78% in 2.5 years.
- India's Infrastructure Bubble (2007–2008): Infrastructure and real estate stocks traded at 100x+ earnings. Many fell 90% in the crash.
- Penny stock manias (recurring): Every few years in India, a theme — defence, drones, EV, clean energy, AI — triggers a micro-bubble in small-cap stocks with no earnings. Most crash 60–80%.
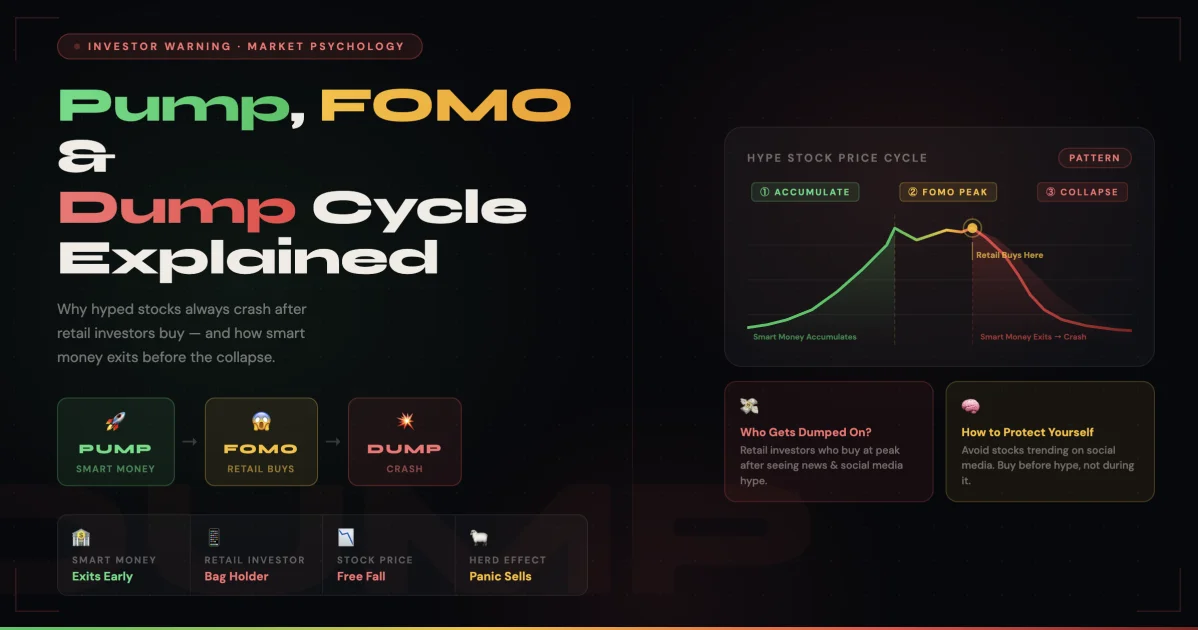
A pump-and-dump stock creates a micro-bubble — same mechanics as a macro bubble, compressed into weeks or months, in a single stock. The stock bubble chart always looks the same: a near-vertical rise followed by an equally sharp crash, with retail investors concentrated at the top.
Pump and Dump — The Mechanism Behind the Crash
What Is Pump and Dump Trading?
Pump and dump is a form of market manipulation where the price of a stock is artificially inflated ("pumped") through coordinated buying and promotional activity, and then the manipulators sell ("dump") their position into the buying pressure created by retail investors who arrived late.
It is illegal under SEBI regulations and the Securities Contracts (Regulation) Act. SEBI regularly issues orders against operators involved in pump-and-dump schemes — but enforcement is slow relative to how frequently it occurs.
The dump phase — exactly how it happens:
Operators have accumulated, say, 30 lakh shares of a small-cap stock at an average of ₹50/share. Total cost: ₹15 crore.
After the pump campaign, retail investors are buying the stock at ₹180–₹220/share, driven by FOMO and upper circuit momentum.
Operators now sell their 30 lakh shares into this buying pressure — at ₹180–₹200/share. Revenue: ₹54–₹60 crore. Profit on a ₹15 crore investment: ₹39–₹45 crore.
As operators dump, their selling pressure overwhelms retail buying. The stock stops hitting upper circuit. It starts hitting lower circuit. Retail investors who bought at ₹180–₹220 try to sell. But there are no buyers. The lower circuit means they literally cannot exit.
The stock falls from ₹220 to ₹80 over two weeks. Then to ₹40. Retail investors who bought at the peak are down 70–80% — on a stock they were told was a "hidden gem."
This is the complete pump-and-dump cycle.
SEBI Raids on Stock Market Operators — Real Enforcement
SEBI has been increasingly aggressive in targeting market operators and pump-and-dump networks:
- 2023–2024: SEBI conducted raids and issued interim orders against multiple entities involved in coordinated stock price manipulation through Telegram channels and social media influencers
- 2024 finfluencer crackdown: SEBI issued new regulations requiring financial influencers to register with SEBI and prohibiting them from promoting specific stocks for payment. Several high-profile influencers were fined.
- Ongoing: SEBI's Integrated Surveillance Department (ISD) uses algorithmic monitoring to flag unusual volume spikes and coordinated trading patterns — the same signals that retail investors should be watching as warning signs, not buy signals.
The existence of SEBI raids itself confirms that stock market operators are real, active, and profitable enough to be worth the legal risk. If SEBI is regularly investigating and penalising them, they are regularly succeeding.
Overvalued Stocks — How to Spot the Trap Before You Enter
Warning Signs of an Overvalued or Manipulated Stock
You don't need insider knowledge to avoid the retail trap. You need to look for signals that are hiding in plain sight:
🚩 Signal 1 — Volume spike with no news
A stock's volume increases 5x–20x with no earnings
announcement, no major business development,
and no regulatory filing explaining it.
This is the single clearest early signal of
operator activity. Genuine volume spikes
have explanations. Manufactured ones don't.
🚩 Signal 2 — Multiple consecutive upper circuits
Legitimate stocks driven by genuine business news
may hit upper circuit once or twice. Five or
more consecutive upper circuits in a small-cap stock
with no fundamental catalyst is almost
always operator-driven price movement.
🚩 Signal 3 — Overvalued metrics relative to sector
Compare the stock's P/E ratio to its sector average.
Overvalued stocks in India caught
in pump cycles often trade at 80–200x earnings
while their sector average is 15–25x.
Check on Screener.in or Tickertape before buying anything.
🚩 Signal 4 — Social media hype before price has history
If you're hearing about a stock from YouTube,
WhatsApp, or Telegram before it has a long price
history justifying the excitement —
you are almost certainly late.
The people promoting it are positioned
earlier than you are.
🚩 Signal 5 — Promoter pledging or low promoter holding
Check the promoter shareholding and pledging data
on BSE/NSE. A promoter who has pledged most of
their shares is under financial stress and may
be colluding with operators. Low promoter holding
means insiders don't believe in the company enough
to hold it themselves.
🚩 Signal 6 — No fundamental news justifying the move
Before buying any stock that has risen dramatically,
ask one question: What has actually changed in
this company's business in the last 30 days?
If the honest answer is "nothing" — the move is
momentum and narrative, not fundamentals.
Momentum reverses. Fundamentals compound.
The Psychology Behind Why Retail Investors Fall for It Every Time
Understanding the mechanics of pump-and-dump is not enough. The trap works because it exploits deeply wired human psychology — and knowing your own biases is what protects you.
Social proof bias:
When many people appear to be making money on
something, the brain interprets this as evidence
that it is safe and correct. In investing,
this is precisely backwards — by the time
social proof is visible, the opportunity is over.
Loss aversion + FOMO combination:
The pain of missing a gain feels psychologically
similar to an actual loss. When someone sees a
stock up 80% and hasn't participated,
the brain registers this as a "loss" of potential
profit — triggering the same emotional response
as losing ₹10,000 from their portfolio.
This emotional response overrides rational analysis.
Narrative bias:
Humans buy stories, not numbers.
"This small company just won a defence contract
and the stock is going to 10x" is a compelling
narrative even when the numbers don't support it.
Operators and promoters craft and distribute these
narratives deliberately. The more exciting
the story, the more sceptical you should be.
Anchoring to recent peak:
Once a retail investor has bought at ₹180,
they anchor to that price. When it falls to ₹130,
they don't sell because "it was at ₹180, it'll go
back." It goes to ₹70. They still hold.
Then ₹40. The anchor becomes a trap.
Smart Investment: How to Actually Make Money in Stocks Long Term
Now that you understand the trap — here is what genuinely successful retail investors in India do differently:
1. They ignore top gainers lists as buy signals
Stocks that have already risen 40–80% are not
buying opportunities. They are warning signals.
Smart investors use gainers lists to understand
market themes — not as a shopping list.
2. They invest in businesses, not charts
Before buying any stock, they read the last 3
annual reports. They understand what the company
sells, who its customers are, how it makes money,
and whether the business is growing.
If you can't explain in two sentences
what the company does, you shouldn't own the stock.
3. They build positions slowly through SIP
Rather than buying ₹50,000 of a stock in one
transaction driven by FOMO, they invest ₹5,000–₹10,000
per month in a Nifty 50 index fund via SIP.
Boring. Effective. The Nifty 50 has delivered
~12% annualised returns over 20 years —
without a single pump-and-dump risk.
4. They set rules before buying
A pre-defined entry price, a stop-loss level,
and a target exit price — set before buying,
not after. Rules made before the emotional
involvement of owning a stock are always better
than decisions made while watching it move.
5. They track their actual performance honestly
Most retail investors who chase pumped stocks
don't track their actual net returns — because
the reality is too uncomfortable.
They remember the wins and forget the losses.
Honest tracking of every investment —
including the bad ones — is how you learn and improve.
⚠️ The Checklist — Before You Buy Any Hyped Stock
- 📊 Volume check: Is today's volume more than 3x the 30-day average with no news? → Red flag. Investigate before buying.
- 📰 News check: Is there a specific, verifiable business development (contract, earnings, regulatory approval) driving the move? → If no: likely operator activity.
- 💹 Valuation check: Is the P/E ratio more than 2x the sector average? → Overvalued. High crash risk.
- 📱 Source check: Did you hear about this stock from YouTube, WhatsApp, or Telegram? → You are being targeted. Not informed.
- 🔁 Upper circuit check: Has this stock hit upper circuit 4+ days in a row with no fundamental news? → Classic pump pattern. Avoid.
- 👤 Promoter check: Is promoter shareholding below 40% or pledging above 30%? → Insiders are not confident. Neither should you be.
- ❓ The two-sentence test: Can you explain in two sentences what this company does and why it will be worth more in 5 years? → If no: don't buy it.
Know What You Own — Track Every Investment Honestly
The final and most important protection against the retail investor trap is honest, ongoing tracking of your investment portfolio.
Most investors who've been caught in pump-and-dump cycles don't realise how much they've lost overall — because they don't track their total investment performance across all positions. They see individual winners in isolation and forget the losers. This selective memory leads them to repeat the same mistakes.
When you track every investment honestly — entry price, current value, gain or loss percentage, and total portfolio performance — the data tells you the truth that emotion hides. You see clearly whether your stock-picking approach is actually working, or whether a Nifty 50 index fund would have outperformed everything you've done in the last three years.
Use RozHisab to log every investment alongside your complete financial picture — income, expenses, savings, and portfolio performance in one place. When you can see your actual numbers clearly, you make decisions based on data — not FOMO.
Because the investors who avoid the retail trap permanently are not the ones who became experts at spotting operators. They're the ones who stopped needing excitement from their investments — and started letting compounding do the work instead.
👉 Start tracking your investments honestly at RozHisab — free, no ads, built for Indian investors who want clarity over chaos.
Quick Reference — Retail Trap Warning Signs vs Smart Investment Signs
- 🚩 Volume spike with no news → vs → ✅ Volume increase after earnings beat
- 🚩 5+ consecutive upper circuits, small-cap, no fundamentals → vs → ✅ Large-cap stock rising on strong quarterly results
- 🚩 WhatsApp/YouTube "hidden gem" tip → vs → ✅ Your own analysis of annual report + sector position
- 🚩 P/E ratio 3–10x above sector average → vs → ✅ Stock trading at or below sector P/E with growth
- 🚩 Buying because "everyone is making money on it" → vs → ✅ Buying because you understand the business and its 5-year potential
- 🚩 No stop-loss, no exit plan → vs → ✅ Pre-defined entry, stop-loss, and target set before buying
- 🚩 FOMO-driven lump sum at peak → vs → ✅ Systematic SIP in index fund regardless of market conditions
Track your own finances — free forever
Use RozHisab to apply everything in this article to your actual spending and savings.
Start Tracking Free →