ℹ️ Disclaimer: This article is for general educational and informational purposes only. It does not constitute financial advice or investment recommendations. All NAV figures, fund examples, and return illustrations are for educational purposes only and do not guarantee future performance. Mutual fund investments are subject to market risk. Please read all scheme-related documents carefully and consult a SEBI-registered investment advisor before investing. RozHisab is a personal finance tracking tool — not an investment advisory service.
Here is a question that reveals one of the most common mistakes in Indian retail investing:
"Fund A has NAV ₹12. Fund B has NAV ₹850. Which one is cheaper to buy?"
If your answer was Fund A — you are not alone. And you are also incorrect.
The assumption that a lower NAV means a cheaper or better fund is one of the most widespread misconceptions among Indian mutual fund investors. It has caused countless people to choose inferior funds, miss better-performing options, and make decisions based on a number that — by itself — tells you almost nothing useful.
This article explains exactly what NAV is, what it measures, what it doesn't measure, and what you should actually look at when comparing mutual funds.
NAV Full Form in Mutual Fund
NAV stands for Net Asset Value.
That is the NAV full form in mutual fund context — Net Asset Value. It is the per-unit price of a mutual fund on any given day.
When you buy units of a mutual fund, you buy them at the NAV declared for that day. When you sell, you sell at the NAV of that day. The difference between your purchase NAV and redemption NAV — multiplied by the number of units you hold — is your profit or loss.
NAV Meaning in Mutual Fund — The Exact Formula
NAV meaning in mutual fund: NAV is the value of one unit of a mutual fund scheme, calculated by dividing the total net assets of the fund by the total number of units outstanding.
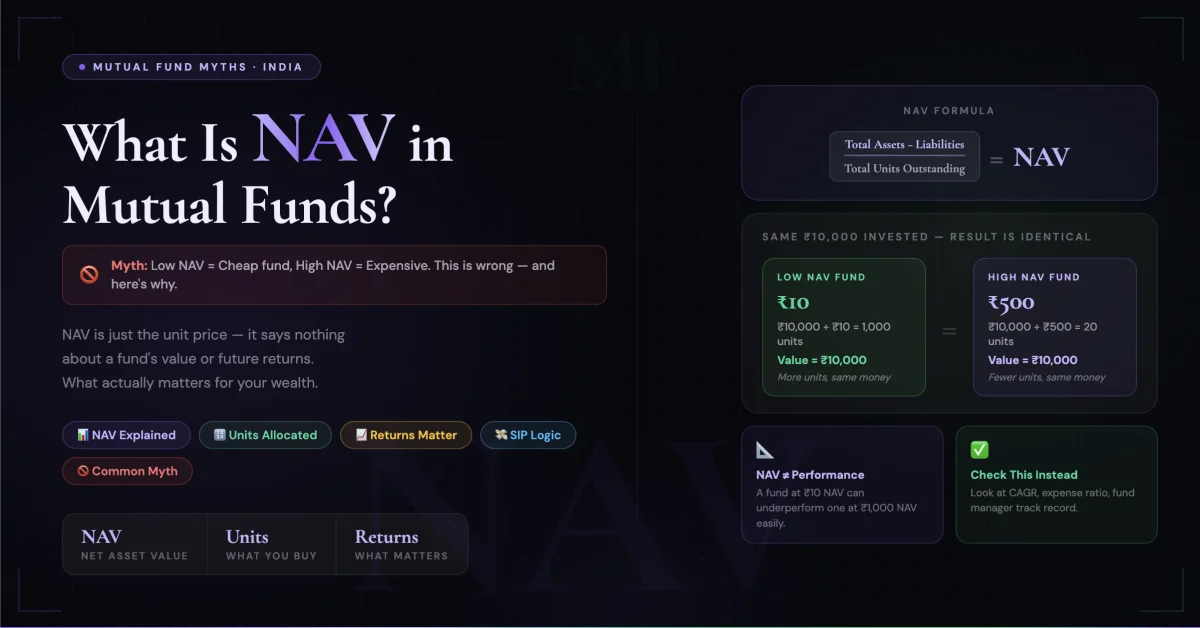
NAV Formula:
NAV = (Total Assets of Fund −
Total Liabilities) ÷
Total Number of Units Outstanding
Simple example:
A mutual fund holds stocks and bonds
worth ₹500 crore in total.
The fund has liabilities (expenses,
fees payable) of ₹2 crore.
Net assets = ₹498 crore.
Total units issued to all investors:
4.98 crore units.
NAV = ₹498 crore ÷ 4.98 crore
= ₹100 per unit
If the stocks in the fund rise in value the next day and the portfolio is now worth ₹510 crore (minus ₹2 crore liabilities = ₹508 crore), the new NAV = ₹508 crore ÷ 4.98 crore = ₹102 per unit.
You made ₹2 per unit. If you held 500 units, your profit for the day: ₹1,000.
Key point: NAV changes every business day based on the closing market prices of the securities the fund holds. It is calculated and published by the fund house after market close — typically by 9–11 PM.
Why NAV Does NOT Tell You Whether a Fund Is Cheap or Expensive
This is the central myth this article exists to correct.
A ₹10 NAV fund is not cheaper than a ₹500 NAV fund. Here is the proof:
Fund A: NAV = ₹10. You invest ₹10,000. You get 1,000 units.
Fund B: NAV = ₹500. You invest ₹10,000. You get 20 units.
Both funds invest in similar stocks. Over 1 year, both funds grow by 15%.
Fund A after 1 year: NAV = ₹11.50. Your 1,000 units = ₹11,500. Profit: ₹1,500.
Fund B after 1 year: NAV = ₹575. Your 20 units = ₹11,500. Profit: ₹1,500.
Identical returns. Identical profit. The NAV number was irrelevant.
What determines your return is not the NAV number — it is how much the NAV grows as a percentage from the day you invested. A 15% NAV growth on ₹10 and a 15% NAV growth on ₹500 give you identical rupee returns on the same investment.
A high NAV simply means the fund has been running for longer and has compounded returns over more years. It is a sign of a mature fund — not an expensive one.
What a High NAV Actually Tells You
If a fund has NAV ₹850 today and was launched at ₹10 (all mutual funds start at ₹10 in India), it means the fund has grown 85x from its launch NAV.
That is not a reason to avoid it. That is potentially a reason to investigate it further — because it suggests a fund with a long track record of positive performance.
NAV history of a fund tells you three useful things:
- How long the fund has existed — older funds have more NAV history
- What the return has been since inception — a fund that went from ₹10 to ₹850 in 15 years has compounded at approximately 33% annually — an excellent track record
- How volatile the fund has been — looking at NAV history shows you how much the fund fell during 2008, 2020, and other crashes — and how quickly it recovered
None of these things are captured in just today's NAV number. You need the mutual fund NAV history — not just the current snapshot.
Mutual Fund NAV History — How to Use It and Where to Find It
What Is Mutual Fund NAV History?
Mutual fund NAV history is the complete record of a fund's daily NAV going back to its launch. Every fund house is required to maintain and publish this data.
What NAV history actually tells you:
1. Long-term return (CAGR):
If NAV was ₹10 in 2010 and is ₹180 today (2026),
the Compound Annual Growth Rate (CAGR) = approximately 20%.
Formula: CAGR = (Current NAV ÷ Initial NAV)^(1/years) − 1
= (180 ÷ 10)^(1/16) − 1 = approximately 20.1% per year.
This is meaningful information.
The current NAV of ₹180 alone is not.
2. Drawdown during crashes:
Look at the NAV in March 2020 (COVID crash)
vs February 2020 (pre-crash peak).
A fund that fell 45% vs one that fell 28%
during the same crash tells you
something about its volatility profile —
even if both recovered fully by 2021.
3. Recovery speed:
How quickly did the fund recover
its pre-crash NAV?
A fund that recovered COVID losses
in 6 months vs one that took 18 months
tells you about its portfolio quality.
Where to check mutual fund NAV history:
- AMFI (amfiindia.com): The Association of Mutual Funds in India is the official source. Go to amfiindia.com → NAV History → select fund house → fund name → date range → download full history
- Value Research (valueresearchonline.com): Best for charting NAV history visually. Search any fund → Performance tab → see NAV chart from inception
- Moneycontrol: Good for historical NAV with benchmark comparison
- Individual fund house websites: All fund houses maintain their own NAV history pages (covered in next section)
Mutual Fund NAV Today — How to Check Current NAV
NAV is published after market close every business day. Here is where to check the current NAV of mutual funds and latest NAV of mutual funds for the major fund houses:
SBI Mutual Fund NAV
Official portal:
sbimf.com → NAV History section
Direct NAV page:
sbimf.com/en-us/nav-history
SBI Mutual Fund is India's largest mutual fund house by AUM. Popular SBI funds and their current NAV category (illustrative, not current prices):
- SBI Bluechip Fund — large-cap equity, high NAV due to long history since 2006
- SBI Small Cap Fund — one of India's most popular small-cap funds, significant NAV appreciation since inception
- SBI Magnum Gilt Fund — government securities debt fund, lower NAV growth by nature (debt is more stable)
✅ To check SBI mutual fund NAV today: sbimf.com → Explore Funds → search fund name → NAV shown on fund page with date of last update.
HDFC Mutual Fund NAV
Official portal:
hdfcfund.com → NAV section
Direct NAV page:
hdfcfund.com/nav
HDFC Mutual Fund is one of India's oldest and most trusted fund houses. The HDFC Flexi Cap Fund (formerly HDFC Equity Fund) is one of India's longest-running funds — started in 1994 — and its NAV reflects over 30 years of compounding. This high NAV is not a barrier to entry — it is a record of exceptional long-term performance.
✅ To check HDFC mutual fund NAV today: hdfcfund.com → All Funds → filter by category → NAV shown next to each fund name with last updated timestamp.
ICICI Prudential Mutual Fund NAV
Official portal:
icicipruamc.com → NAV section
Direct NAV page:
icicipruamc.com/nav
ICICI Prudential is another of India's largest fund houses. The ICICI Prudential Balanced Advantage Fund is one of India's most popular hybrid funds — dynamically adjusting equity-debt allocation based on market valuations. Its NAV history reflects this strategy's performance through multiple market cycles.
✅ To check ICICI Prudential mutual fund NAV today: icicipruamc.com → Our Funds → search fund → NAV displayed with previous day comparison.
Other Fund Houses — Quick NAV Links
- Mirae Asset: miraeassetmf.co.in
- Nippon India: nipponindiamf.com
- Axis Mutual Fund: axismf.com
- Kotak Mutual Fund: kotakmf.com
- UTI Mutual Fund: utimf.com
- DSP Mutual Fund: dspim.com
- Parag Parikh Mutual Fund: ppfas.com
Fastest way to check any fund's NAV: Go to amfiindia.com/nav-history → this is the single authoritative source for all NAV data in India — covering every fund from every fund house in one place.
What You SHOULD Look at Instead of NAV
If NAV by itself is not meaningful, what should you actually evaluate when choosing a mutual fund? Here are the five metrics that matter:
1. CAGR (Compound Annual Growth Rate)
— 3, 5, and 10 year:
This is the annualised return
the fund has delivered.
Compare the fund's 5-year CAGR
to its benchmark index
(e.g., Nifty 50 for a large-cap fund)
and to its category peers.
A fund consistently beating
its benchmark by 2–3% annually
over 10 years is a good fund —
regardless of whether its NAV
is ₹15 or ₹1,500.
2. Expense Ratio:
The annual fee charged by the
fund house to manage your money —
expressed as a percentage of AUM.
A Direct Plan expense ratio
of 0.10–0.50% is good.
A Regular Plan expense ratio
of 1.5–2.5% is significantly
higher — and this difference
compounds against your returns
over 10–15 years.
Lower expense ratio = more of
the fund's returns stay with you.
3. Risk-Adjusted Return
(Sharpe Ratio):
Two funds may show similar 5-year returns.
But one may have achieved them
with extreme volatility (big crashes,
big recoveries) while the other
moved more smoothly.
The Sharpe Ratio measures
return per unit of risk taken —
higher is better.
Available on Value Research
and Morningstar India.
4. Fund Manager Track Record:
How long has the current fund manager
been managing this fund?
A fund with a 15-year excellent
track record whose manager
changed 2 years ago deserves
fresh evaluation — the track record
belongs partly to the previous manager.
5. AUM (Assets Under Management)
— for small and mid-cap funds:
Very large AUMs in small-cap funds
create a problem — the fund becomes
too large to invest nimbly
in genuinely small companies.
For small-cap and mid-cap funds,
an AUM that is too large
can actually hurt returns.
For large-cap and index funds,
larger AUM generally means
better liquidity and lower tracking error.
Which Mutual Fund Is Best for Long Term — How NAV Fits Into the Decision
⚠️ The following is general educational information about mutual fund categories — not a recommendation to invest in any specific fund. Please consult a SEBI-registered advisor for personalised advice.
For long-term investing (10+ years), the category of fund matters far more than any individual fund's current NAV. Here is how to think about categories:
For pure wealth creation (highest growth potential):
Equity mutual funds —
specifically Nifty 50 Index Funds
(for beginners) or Flexi Cap Funds
(for more experienced investors).
NAV to look for: a consistent
upward trend in NAV history
with recoveries after every crash.
For balanced growth with lower volatility:
Hybrid funds — specifically
Balanced Advantage Funds (BAF)
or Aggressive Hybrid Funds.
NAV history should show
significantly lower drawdowns
during 2008, 2020, and 2022
compared to pure equity funds.
For capital preservation with
some growth:
Debt mutual funds —
specifically Short Duration
or Corporate Bond Funds.
NAV history should show
a very smooth, consistent upward
curve with minimal volatility —
unlike equity fund NAV history
which will show sharp dips.
Best sectors to invest in
right now via mutual funds:
Rather than picking individual
sector funds (which concentrate risk),
most long-term investors are better served
by diversified equity funds
that have exposure to
growing sectors automatically —
IT, pharmaceuticals, financial services,
and consumption are sectors that
most large-cap and flexi-cap funds
already hold in their portfolios.
Let the fund manager handle
sector allocation —
your job is to choose the right
fund category and invest consistently.
The NAV Myth That Costs Indian Investors Real Money — A Real Scenario
Here is a scenario that plays out regularly in India:
An investor wants to invest ₹50,000 in a mutual fund for the first time. They look at two options:
Fund X: NAV ₹15. A recently launched fund with 2 years of history. "Seems affordable."
Fund Y: NAV ₹680. A 20-year-old fund with a strong long-term track record. "Too expensive — NAV is very high."
The investor chooses Fund X because it "feels cheaper."
What they missed:
Fund Y's NAV of ₹680 vs its
launch NAV of ₹10 represents
68x growth — approximately 23%
CAGR over 20 years.
Fund X has 2 years of history
and insufficient data to
evaluate its long-term quality.
Both investors put in ₹50,000. 10 years later at 12% CAGR (a hypothetical assumption — not a guarantee):
- Fund X investor (if fund maintains 12%): ₹50,000 → approximately ₹1,55,000
- Fund Y investor (if fund maintains its historical 23% CAGR): ₹50,000 → approximately ₹4,80,000
The NAV number on day one predicted nothing about this outcome. The fund's quality and historical performance predicted everything.
This is why NAV doesn't matter as much as you think — and why what you look at instead of NAV matters enormously.
SIP and NAV — Why NAV Actually Works in Your Favour When You SIP
Here is the one context where daily NAV fluctuations work actively in your favour:
When you invest via SIP (Systematic Investment Plan), your fixed monthly amount buys more units when NAV is low and fewer units when NAV is high — automatically, without any action from you.
This is called Rupee Cost Averaging and it is one of SIP's most powerful benefits.
Example over 3 months:
- Month 1: NAV = ₹100. ₹5,000 invested. Units purchased: 50.
- Month 2 (market falls): NAV = ₹80. ₹5,000 invested. Units purchased: 62.5.
- Month 3 (market recovers): NAV = ₹110. ₹5,000 invested. Units purchased: 45.45.
Total invested: ₹15,000.
Total units: 157.95.
Average cost per unit: ₹94.97.
Current NAV: ₹110.
Current value: ₹17,374 — a 15.8% gain
despite the market dip in Month 2.
If you had invested ₹15,000 as a
lump sum in Month 1 at NAV ₹100,
you'd have 150 units worth ₹16,500 —
a 10% gain.
SIP gave better returns despite
the same ending NAV —
because the intermediate dip
bought you more units automatically.
This is why checking NAV daily and worrying about whether today is a "good NAV to buy at" completely misses the point. The SIP mechanism handles this for you.
Track Your Mutual Fund NAV and Returns in One Place
Most investors who invest in mutual funds across multiple platforms have no idea what their overall portfolio is doing.
They have SBI funds on Groww, HDFC funds on Zerodha Coin, ICICI Prudential on Paytm Money — and no single view of their total investment value, overall XIRR return, or how much of their monthly income is going into investments.
Use RozHisab to log every SIP investment across all fund houses alongside your monthly income and expenses. See your total invested amount, current value, and savings rate in one unified dashboard — completely free, no bank linking required, built specifically for Indian households investing across multiple platforms.
Because the investors who build real wealth from mutual funds are not the ones who checked NAV every day. They are the ones who invested consistently, tracked honestly, and stayed in the market long enough for compounding to do its work.
👉 Start tracking all your mutual fund investments for free at RozHisab — log your SIPs, see your overall returns, and know exactly where your money is working.
Quick Reference — NAV in Mutual Funds Explained
- 📌 NAV full form: Net Asset Value
- 📌 NAV meaning in mutual fund: Per-unit price of a mutual fund — total net assets ÷ total units outstanding
- 📌 NAV is updated: Every business day after market close (typically by 9–11 PM)
- 📌 High NAV = expensive fund? No. High NAV = mature fund with long history of growth. Same ₹10,000 invested grows at the same percentage regardless of starting NAV.
- 📌 What actually matters: 3/5/10-year CAGR, expense ratio, Sharpe ratio, fund manager track record
- 📌 Where to check NAV history: amfiindia.com (official), valueresearchonline.com (visual charts)
- 📌 SBI mutual fund NAV: sbimf.com → NAV History
- 📌 HDFC mutual fund NAV: hdfcfund.com → NAV
- 📌 ICICI Prudential NAV: icicipruamc.com → NAV
- 📱 Track all SIPs together: Log on RozHisab — free, Indian-focused, no bank linking
📌 Disclaimer: This article is for educational purposes only and does not constitute financial or investment advice. All fund examples, NAV figures, and return calculations are illustrative only and do not represent actual current data or predict future performance. Mutual fund investments are subject to market risk. Read all scheme documents carefully. Consult a SEBI-registered investment advisor before investing. RozHisab is a budgeting and expense tracking tool — not an investment advisory service.
Track your own finances — free forever
Use RozHisab to apply everything in this article to your actual spending and savings.
Start Tracking Free →